
How we spend your Council Tax
How is your Council Tax spent in the district?
The range of services provided by North Norfolk District Council, Parish Councils and Town Councils includes refuse collection, housing advice, benefits, recycling, planning services, street cleaning, business growth, parks and leisure facilities, coast and flood defences and much, much more.
North Norfolk District Council is funded by government grants and a redistributed proportion of business rates which are set nationally, together with revenue from Council Tax, which is set locally.
| North Norfolk District Council Funding from 2026 to 2027 | ||
| Description | Amount | |
| Central Government Grant Funding | £13.534m | |
| Council Tax - District Council | £8.285m | |
| Council Tax - Town and Parish Councils | £4.318m | |
| Total | £26.137m | |
| With approximately 105,000 people living in North Norfolk, this equates to £248.92 per person | ||
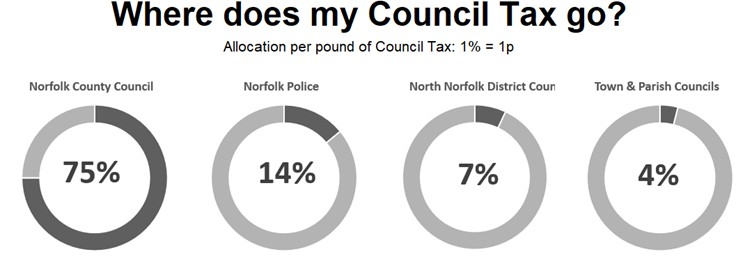
Where your Council Tax goes
North Norfolk District Council is the billing authority for the district of North Norfolk, meaning NNDC sends out Council Tax bills to residents and collects the Council Tax. However, most of this is distributed to Norfolk County Council and Norfolk Police Authority, with a small portion going to town and parish councils.
Each £1 of Council Tax that we collect is split as follows:
- 75p - Norfolk County Council
- 14p - Norfolk Policy Authority
- 7p - North Norfolk District Council
- 4p - Town and Parish Councils
The money that is received by Norfolk County Council is to pay for services such as education, social services, waste disposal, libraries, fire and rescue. How Norfolk County Council spend this money is detailed on their Council Tax page.
The money that is received by the Norfolk Police and Crime Commissioner goes towards providing policing across Norfolk.
How is your Council Tax spent by the District Council?
The range of services provided by North Norfolk District Council, Parish Councils and Town Councils includes refuse collection, housing advice, benefits, recycling, planning services, street cleaning, business growth, parks and leisure facilities, coastal and flood defences.
Council expenditure is split into two main types:
- Capital
- Revenue
Capital expenditure
Capital spending is for one-off projects such as major improvement works, initiatives or infrastructure procurement. The following table shows the Capital Projects that the Council is committed to funding.
| Capital (Project) expenditure | ||
| Category | 2025/26 (actual) | 2026/27 (forecast) |
| Our Greener Future | £17,475,242 | £14,315,002 |
| Developing Our Communities | £1,605,582 | £14,337,003 |
| Meeting our Housing Need | £3,089,060 | £6,200,635 |
| Investing in our Local Economy and Infrastructure | £3,308,358 | £3,231,603 |
| A Strong, Responsible and Accountable Council | £223,745 | £363,320 |
| Total | £25,702,017 | £38,447,563 |
Revenue spending
Revenue spending is any recurring costs such as salaries, maintenance and consumables. The following table shows revenue expenditure budgets for the Council.
| Revenue Expenditure £m | ||||||
|---|---|---|---|---|---|---|
| 2025/26 (budget) | 2026/27 (budget) | |||||
| Service | Total amount needed | Less Income | Net Amount Needed | Total amount needed | Less Income | Net amount needed |
| Environmental and Leisure Services | £15.3 | (£6.7) | £8.6 | £14.8 | (£6.0) | £8.8 |
| Finance and Assets | £32.5 | (£29.0) | £3.5 | £23.5 | (£21.5) | £2.0 |
| Legal and Governance | £4.0 | (£3.4) | £0.6 | £4.3 | (£0.1) | £4.2 |
| People Services | £7.8 | (£4.7) | £3.1 | £3.8 | (£1.7) | £2.1 |
| Planning | £5.4 | (£2.1) | £3.3 | £3.6 | (£1.7) | £1.9 |
| Sustainable Growth | £5.0 | (£1.5) | £3.5 | £3.2 | (£0.4) | £2.8 |
| Corporate | £4.2 | (£3.8) | £0.4 | £2.8 | (£0.1) | £2.7 |
| Adjustment for notational charges included above | £1.4 | (£4.3) | (£2.9) |
£1.5 |
(£5.1) | (£3.6) |
| Investment Income | £0 | (£1.4) | (£1.4) | £0.0 | (£1.4) | (£1.4) |
| Contributions to and from reserves | £1.5 | (£0.0) | £1.5 | £1.0 | £0 | £1.0 |
| Retained Business Rates | £0 | (£8.7) | (£8.7) | £0.0 | (£5.6) | (£5.6) |
| Grant funding | £0 | (£3.7) | (£3.7) | £0.0 | (£7.9) | (£7.9) |
| Parish Precepts | £3.8 | (£3.8) | £0.0 | £4.3 | (£4.3) | £0.0 |
| Total | £80.8 | (£73.0) | £7.8 | £62.8 | (£55.8) | £7.0 |
Large Town Councils
Town and Parish Councils with annual precepts set in excess of £140,000 are required to publish data that details their Council Tax Requirement. There are six Town Councils that are required to do so in 2026/27. Please refer to the Town Council websites for their full budget details.
| Cromer Town Council | ||
| Category | 2025/26 | 2026/27 |
| Gross Expenditure | £513,910 | £559,560 |
| (Gross Income/Use of Reserves) / Contribution to Reserves | (£109,414) | (£148,539) |
| Council Tax requirement (Parish Precept) | £404,496 | £411,021 |
| Fakenham Town Council | ||
| Category | 2025/26 | 2026/27 |
| Gross Expenditure | £546,700 | £763,125 |
| (Gross Income/Use of Reserves) / Contribution to Reserves | (£20,975) | £98,737.67 |
| Council Tax requirement (Parish Precept) | £567,675 | £861,862.67 |
| Holt Town Council | ||
| Category | 2025/26 | 2026/27 |
| Gross Expenditure | £218,406 | £269,981 |
| (Gross Income/Use of Reserves) / Contribution to Reserves | (£19,380) | (£19,205) |
| Council Tax requirement (Parish Precept) | £199,026 | £250,776 |
| North Walsham Town Council | ||
| Category | 2025/26 | 2026/27 |
| Gross Expenditure | £526,051 | £540,000 |
| (Gross Income/Use of Reserves) / Contribution to Reserves | (£95,321) | (£76,400) |
| Council Tax requirement (Parish Precept) | £430,730 | £463,600 |
| Sheringham Town Council | ||
| Category | 2025/26 | 2026/27 |
| Gross Expenditure | £474,350 | £430,154 |
| (Gross Income/Use of Reserves) / Contribution to Reserves | (£69,946) | (£7,140.56) |
| Council Tax requirement (Parish Precept) | £404,404 | £437,294.56 |
| Stalham Town Council (Parish Precept) | ||
| Category | 2025/26 | 2026/27 |
| Gross Expenditure | £219,440 | £182,084 |
| (Gross Income/Use of Reserves) / Contribution to Reserves | (£19,440) | (£17,916) |
| Council Tax requirement (Parish Precept) | £200,000 | £200,000 |
Still need help?
Visit our contact us page for further assistance about our popular services and information.